Dynatrace has extended its PurePath distributed tracing and code-level analysis technology to OpenTelemetry data, service mesh, and serverless computing. Capturing transactions end-to-end and providing observability data automatically enables collaboration across development, operations, and applications teams with unique analytics. Dynatrace Davis, the only open, deterministic AI engine provides full automatic root-cause analysis and enables automation for digital enterprises.
Optimal customer experience and faster time to market are key to a successful digital transformation of any enterprise. The rapidly evolving digital landscape is one important factor in the acceleration of such transformations – microservices architectures, service mesh, Kubernetes, Functions as a Service (FaaS), and other technologies now enable teams to innovate much faster.
New cloud-native technologies make observability more important than ever…
Technical complexity has shifted from the actual code to the intaerdependencies between services. Environments are highly dynamic, with ephemeral elements like containers or FaaS.
Every tap in a mobile app triggers requests that, potentially, travel through a myriad of microservices, routed from one service to the next by service meshes, calling several serverless functions.
In addition, the teams building and running applications are working with different technologies in parallel. In the end, however, all these technologies must work together. If there’s an issue with just one of the services, user experience will suffer.
To quickly deploy new high-quality releases that deliver outstanding customer experiences and achieve your intended business outcomes, observability across all these technologies with distributed tracing is key.
…and introduce new challenges for teams working in heterogenous and web-scale environments.
To achieve observability and apply distributed tracing, IT teams leverage varying methods for the different parts of their application stack. Methods include the observability capabilities of the platforms their applications run on; monitoring tools, OpenTelemetry, OpenTracing, OpenMonitor, OpenCensus, Jaeger, Zipkin, Log, CloudWatch, and more.
However, in a world where everything is connected, it’s insufficient for individual teams to only have insights into their pieces of an application. Especially in heterogenous and multicloud environments, all components need to be assembled, with individual contributions working in context with one another.
Even then, with the size and diversity of web-scale environments, DIY solutions and manual approaches to understanding cause-and-effect chains (and deriving the right conclusions for improving applications or resolving issues) are getting more complex. An effective solution to this problem must be able to handle scale, depth, breadth, and heterogeneity across the software lifecycle. This is where Dynatrace comes into play.
Dynatrace PurePath 4 extends automatic distributed tracing to OpenTelemetry and the latest cloud-native technologies
In 2006, Dynatrace released the first production-ready solution for distributed tracing with code-level insights. PurePath distributed tracing technology enables teams – and Davis – to see how different services are connected and how requests flow through the application environment.
Dynatrace has continuously extended and improved PurePath to the point where it now provides industry-leading transaction capturing and code-level analysis for the broadest set of technologies, with some additional and unique capabilities:
- Frontend to backend
Distributed tracing with Dynatrace PurePath begins with real user actions. This enables an outside-in view into applications, rooted in business outcomes and user experiences on mobile, web, or hybrid-apps.
- Zero configuration
Dynatrace OneAgent, our continuous auto-discovery and auto-instrumentation technology, provides end-to-end visibility with no manual configuration required. Just one command instruments your entire application environment for monitoring.
- Automatic topology analysis
Dynatrace Smartscape, our continuous topology mapping technology, automatically and continuously maps and visualizes interdependencies between application components.
- Near-zero overhead
PurePath captures transactions for the most popular languages and technologies with practically no overhead.
With the 4th generation of PurePath, our distributed tracing and code-level analysis technology, we’re introducing support for the latest cloud-native technologies:
- PurePath 4 supports OpenTelemetry auto- and custom-instrumentations. The seamless integration enables enrichment of your OpenTelemetry metrics and traces with insights from the Dynatrace Software Intelligence Platform.
- OpenTracing data is seamlessly integrated by PurePath 4, which also unlocks more than 30 pre-instrumented technologies.
- PurePath 4 supports serverless computing out-of-the-box, including Kubernetes services from Amazon Web Services (AWS), Microsoft Azure, and Google Cloud Platform (GCP).
- FaaS like AWS Lambda and Azure Functions are seamlessly integrated with no code changes.
- Support for Istio/Envoy service mesh provides out-of-the-box insights into service-to-service communications.
- Support of W3C Trace Context ensures end-to-end visibility, even when services from other teams (which may be monitored with other solutions) are called in the middle of transactions.

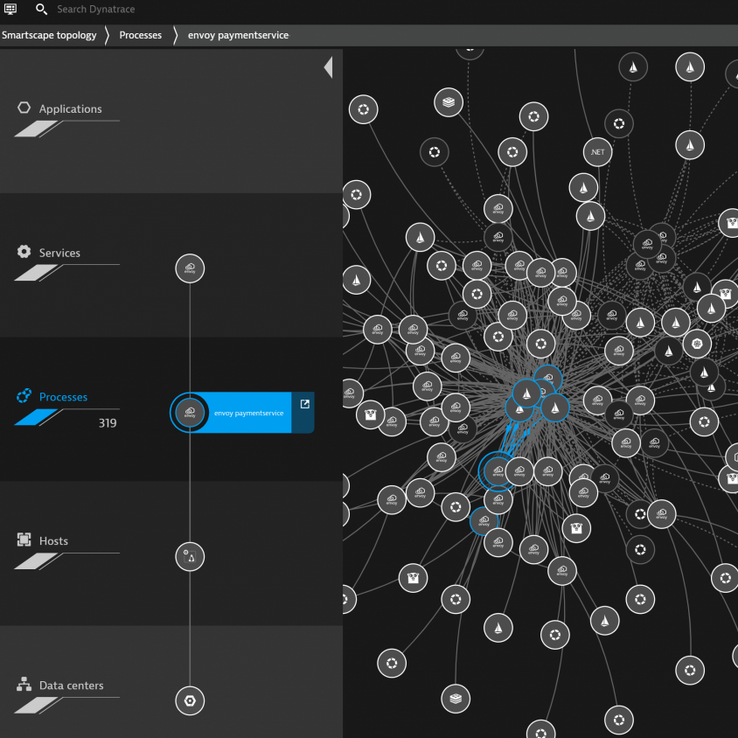
Dynatrace puts all PurePaths into its entity model. The Smartscape topology model gives you an overview of how the different components of your environment relate to each other, vertically and horizontally. In this example you can see on the left side that the Envoy payment service is running on a Linux host, deployed in the Google cloud. On the right side you can see the connections to Istio instances that are sending data to the Envoy payment service.
PurePath unlocks precise and actionable analytics across the software lifecycle in heterogenous cloud-native environments
While Dynatrace fully automates root-cause analysis in the case of application issues, there are instances when you want to analyze your application manually (for example, identifying hot spots for continuous improvement). To understand what’s going on, and to optimize dynamic, heterogenous, cloud-native architectures, the ability to see the big picture is critical. Dynatrace provides information on every request, through every single microservice or serverless function, seamlessly integrating OpenTelemetry, with powerful analytics, including:
- Out-of-the-box service hotspot analysis
Dynatrace analyzes the response time of each service running within each process, displaying findings out-of-the-box for further investigation. Requests with slow response times, high failure rate, or high CPU consumption automatically appear in this view, providing analytics at-scale, even for the largest Kubernetes environments.
- End-to-end observability across your functions and services
Powered by PurePath, the Dynatrace Service flow illustrates the sequence of service calls that are triggered by each service request in your environment, across all technologies, including AWS Lambda or code instrumented with OpenTelemetry. Service flow enables you to slice and dice monitoring data based on various attributes to isolate certain flows down to single requests for even further analysis.
- Investigate which calls led to a specific request
Dynatrace Service backtrace helps you to understand the sequence of preceding service requests that ultimately triggered an action, for example, an incoming request to a specific Azure function.
- Waterfall visualization of all requests
PurePath analytics provide a waterfall visualization of all requests, making it easy to identify hotspots. Each service in the call chain is represented in the PurePath and provides rich metadata for further analysis, thereby extending OpenTelemetry data with built-in expertise.
- Deep-code execution details
Dynatrace uniquely provides code-level information for many technologies. With one click in a PurePath visualization, you can drill into the code execution of any request.
- Always-on profiling in transaction context
Continuous memory, thread, and CPU analysis in context with all related transactions allows you to optimize your code based on real-time information from production environments.
- Analyze, chart, and report application- and transaction-driven KPIs
Application- and transaction-driven KPIs are at the heart of any successful business. Well-defined metrics for your applications and microservices should also be at the heart of your technical analysis. Powered by PurePath data, you can analyze and optimize any kind of data in Dynatrace, splitting it based on every available dimension.
Dynatrace is the only observability solution that brings together high-fidelity distributed tracing, code-level visibility, and advanced diagnostics across the most advanced cloud-native architectures, while supporting open standards with automation and AI at the core.

Service Flow enables you to analyze multiple PurePaths at the same time. Here you can see that 145 different PurePaths start in an Istio ingress gateway, and traverse through multiple microservices.

Dive deeper into a specific PurePath and find out why a specific call had a delay or returned an error.

The Dynatrace OneAgent automatically collects OpenTelemetry span information, which helps you understand how much time is consumed by each span. In this specific example these are embedded into a custom GoLang application.
Dynatrace Davis – the AI that automates root-cause analysis to drive cloud automation
With these latest enhancements to PurePath, Dynatrace Davis now also uses OpenTelemetry data and data gathered from the newly supported cloud-native technologies for its continuous analysis. The precise AI-powered answers that Davis provides enable teams to resolve issues before customers are impacted and, ultimately, automate the remediation of problems.
- The only deterministic and open AI -engine for observability data
Davis doesn’t rely on data correlation. Davis is a deterministic AI- engine that leverages causal dependencies between components, including serverless components, service mesh, and services instrumented with OpenTelemetry. PurePath continuously discovers and analyzes new dependencies.
- Anomaly detection without manual threshold definition
You don’t have to provide thresholds manually. Dynatrace Davis uses intelligent auto-baselining to learn what’s “normal.” It then continuously and automatically adjusts the baselines as environments change.
- Automatic root-cause analysis
Davis pinpoints the precise root-cause of issues by working through billions of dependencies in real time and consolidating actionable insights into a single problem notification, which facilitates any automated remediation efforts.
- No more alert storms
By automatically pinpointing the root-causes of issues and grouping all incidents in an application environment accordingly, Dynatrace separates the signal from the noise, out-of-the-box.
- Business impact analysis included
As Dynatrace PurePath provides an outside-in view starting with real user actions, Davis determines the severity of an anomaly in terms of its impact on real users and business KPIs. You can even get the list of users who were affected by specific glitches in your mobile app with a backend running on Kubernetes extended with AWS Lambda functions.

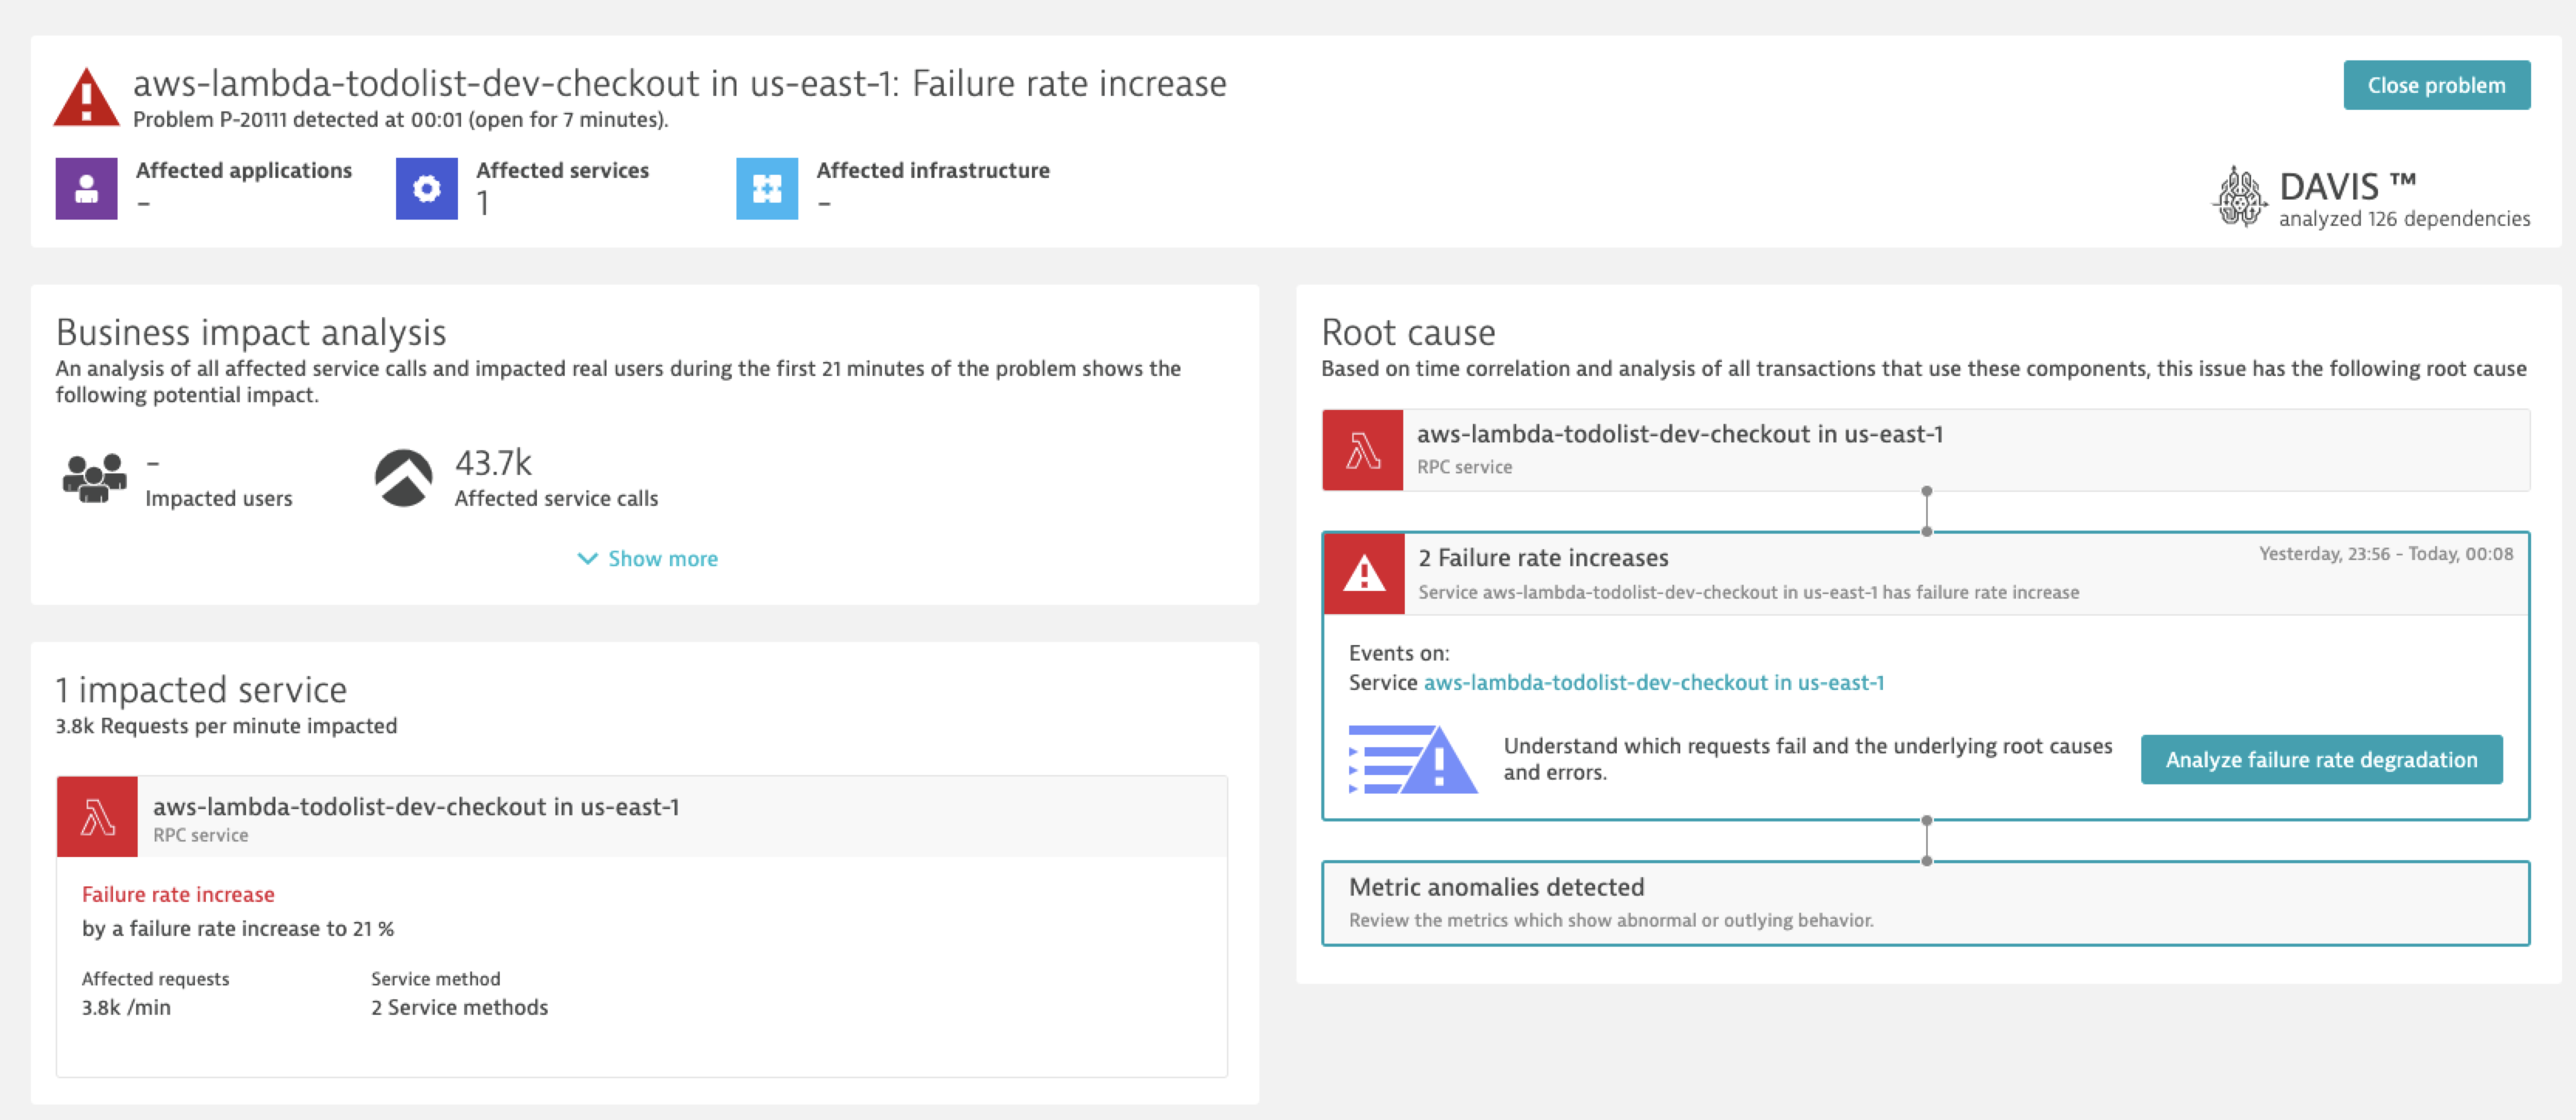
Dynatrace detects and monitors your Lambda functions the same way as any other services. The Davis AI automatically detects errors on Lambda functions and guides you directly to the root cause.
Dynatrace provides an open platform for automatic and intelligent observability, built for web-scale and easy automation
Dynatrace provides an all-in-one platform for development, operations, and application teams. It enables collaboration and, ultimately, automation based on intelligent observability at scale. Our platform is built for the world’s largest enterprises, providing:
- Automation and AI at the core
As some examples above illustrate, Dynatrace is built with automation and AI at its core for immediate value and lowest TCO. It will change the way your teams work.
- Open platform for automatic and intelligent observability
At Dynatrace, we’re fully committed to the latest open standards like OpenTelemetry, and are continuously working on seamless integrations and extensibility, unlocking data analysis and AI-powered answers at scale for cloud-native teams.
- Granular access management, built for cloud-native teams
To fulfill the requirements of innovative companies, Dynatrace reinvented access permissions. Fueled by PurePath and the automatic detection of interdependencies between application components, Dynatrace uniquely offers role-based governance and granular access permissions based on apps, services, and more.
- API first
Dynatrace follows an “API first” mantra that enables companies to accelerate their software lifecycle with automation while simultaneously automating the management of Dynatrace itself in dynamic and large environments.
- Technical scalability without limits
Built on an extensible cloud-native architecture, including built-in robust load-balancing, traffic optimization, encryption, and highly tuned algorithms, Dynatrace scales up to the requirements of the world’s largest companies.
- Highest availability and security out-of-the-box
Dynatrace provides the highest availability and security out of the box, making it suitable for large government projects.
- Data flexibility, SaaS comfort, and manageability at scale
In addition to its SaaS deployment offering, Dynatrace also offers you the flexibility to keep your data on premises. Both options can be set up in minutes, including single-command OneAgent deployment and the comfort of SaaS-like bi-weekly feature updates.
